
|
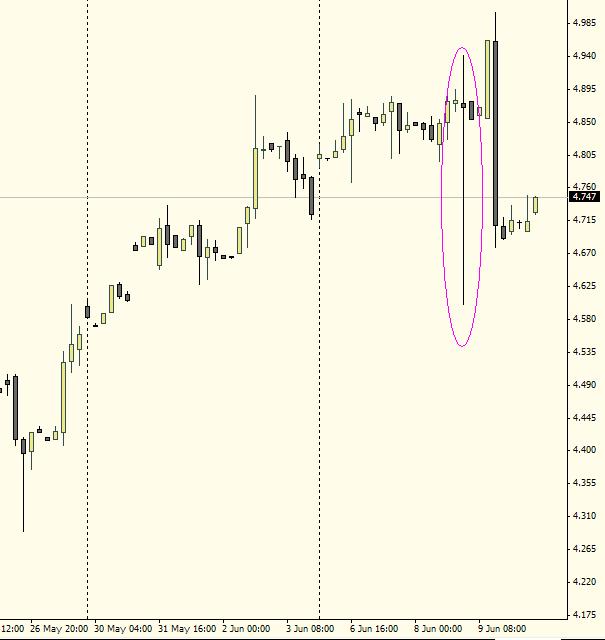
Скоростные автоматические торговые системы, эти рыночные пираньи, скальпирующие микронеэффективности рынка доминируют сейчас на рынке. 8 июня можно было увидеть очень любопытные движения во фьючерсе на натуральный газ, торгуемом на NYMEX. Кому это интересно, могут посмотреть много графиков, поясняющих эти движения на сайте компании NANEX, которая занимается исследованиями манипуляций с помощью алгоритмических систем. http://s07.radikal.ru/i180/1106/28/0ad8515cace5.jpg Расширяющаяся синусоида очень красива. А вот так выглядит весь краткосрочный эпизод торговли целиком. http://s42.radikal.ru/i097/1106/2d/ed36ed770863.jpg Спустя два дня на 4-часовом графике. Обратите внимание, кстати, что низ шипа - цифры NYMEX существенно отличаются от цифр форексброкера; цена дошла до 4,52, а не 4,58. Это типичная манипуляция форексброкера.
Можно спорить по поводу того, что здесь происходило The "Fractal" Limit Order Buster: The Latest Market Manipulation Algo Gimmick
Zero Hedge считает, что здесь работало устройство для манипуляций рынком, которое пожирало лимитордера, и истинная цель которого было дестабилизировать рынок и создать волатильность для создателя алготорговли. На мой взгляд здесь работала система «ложный пробой», целью которой помимо тривиальной заработать денег была разведка. Она была мощно заправлена капиталом и буквально издевалась над рынком. Система хотела выяснить: (1) параметры других аналогичных систем, присутствующих на рынке (2) вообще их количество (3) пассивное присутствие других игроков в инструменте - плотность размещения лимитордеров и других ордеров в этом диапазоне. Диапазон кстати очень приличный: 9%. (4) реакция в коррелирующих инструментах и т.д. Обычно такая разведка производится перед серьезным движением рынка. Случайно или нет, но ей удалось достаточно серьезно прогнать цену. Естественно, что они не стали пытаться пробиться через уровень 4,5. Здесь могло стоять очень много заявок на покупку, да и живые трейдеры могли спохватиться. Самая большая волна заняла всего 9 секунд. В интервале 4,52-4,73 были такие же объемы, как и в синусоиде, и это говорит о том, что человек скорее всего не подключался к торговле. От начала и до конца работал только робот. А вот что пишет NANEX
NANEX здесь подмечает интересную особенность. При росте цены сделки исполнялись по биду, а при падении по аску. Это противоположно тому, как рынок должен себя вести. Резюме: не занимайтесь скальпированием, господа. Алготрейдер, этот настраиваемый «однорукий бандит», вас все-равно обыграет. |
Поиск котировок:Например: Газпром
|
|
© 2024 «МФД-ИнфоЦентр»
Все права защищены. Перепечатка материалов возможна только со ссылкой на mfd.ru.